215: China Demographic Analysis: Population

pic courtesy: Visualcapatalist.com 


Population

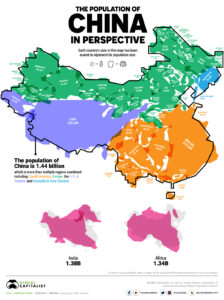
The current population of China is 1,446,554,428 (as of Thursday, October 21, 2021, based on World meter elaboration of the latest United Nations data).

China ranks number 1 in the list of countries by population.

China population is equivalent to 18.47% of the total world population.


Population Trend

50 years back China had touched growth rate of 2+ by percentage.

The growth rate has come down to about 0.4 percent now.

If present trend continues, zero growth rate will be reached somewhere between 2030 and 2035.

Thereafter it will be in negative.

By 2030 China will not be the most populace country. It will drop to number 2 position.


Population control

Initially, China’s post-1949 leaders were ideologically disposed to view a large population as an asset. But the liabilities of a large, rapidly growing population soon became apparent.

In 1972 and 1973 the party mobilized its resources for a nationwide birth control campaign administered by a group in the State Council. Population growth targets were set for both administrative units and individual families. In the mid-1970s the maximum recommended family size was two children in cities and three or four in the country.

One Child Policy. Since 1979 the government has advocated a one-child limit for both rural and urban areas and has generally set a maximum of two children in special circumstances. The overall goal of the one-child policy was to keep the total population within 1.2 billion. The one-child policy was unique, however, in that it linked reproduction with economic cost or benefit. Under the one-child program, a sophisticated system rewarded those who observed the policy and penalized those who did not. Through this policy, the rate of increasing population was tempered after the penalties were made. Couples with only one child were given a “one-child certificate” entitling them to such benefits as cash bonuses, longer maternity leave, better child care, and preferential housing assignments. In return, they were required to pledge that they would not have more children. The one-child policy enjoyed much greater success in urban than in rural areas.

Rapid fertility reduction associated with the one-child policy has potentially negative results in terms of increase in median age.


Median Age and Trend

The median age in China is 38.4 years.

50 to 60 years back it was close to 20 years.

If present trend continues, the median age of china will touch close to 50 years by 2050.

Even though China has already opened two-child policy since 2016, data shows that the second-child policy cannot stop the problem of an aging population.


Population Density.

The population density in China is 153 per Km2 (397 people per mi2).

50 years back this figure was about 90.

By 2050, it will touch a figure of 150.


Distribution

Broadly speaking, the population is concentrated in the east.

The most densely populated areas included the Yangtze River Valley (of which the delta region was the most populous), Sichuan Basin, North China Plain, Pearl River Delta, and the industrial area around the city of Shenyang in the northeast.

Population is most sparse in the mountainous, desert, and grassland regions of the northwest and southwest.

In Inner Mongolia Autonomous Region, portions are completely uninhabited, and only a few sections have populations denser than ten people per km2. The Inner Mongolia, Xinjiang, and Tibet autonomous regions and Qinghai and Gansu comprise 55% of the country’s land area but in 1985 contained only 5.7% of its population.


Urban / Rural Distribution and trend

60.8 % of the population is urban.

50 years back this percentage was about 20%.

By 2050, the urban population would touch about 80 %.


Largest Cities in China (by Population) are:-

CITY NAME POPULATION
1 Shanghai 22,315,474
2 Beijing 11,716,620
3 Tianjin 11,090,314
4 Guangzhou 11,071,424
5 Shenzhen 10,358,381
6 Wuhan 9,785,388
7 Dongguan 8,000,000
8 Chongqing 7,457,600
9 Chengdu 7,415,590
10 Nanjing 7,165,292


Other Figures and Trends

According to the 2020 census, 91.11% of the population is Han Chinese, and 8.89% are other minorities.

Life expectancy is 77.5. This figure was close to 45 years about 70 years back and about 60 50 years back.

Infant Mortality rate is 8.4 per 1000 births.


Suggestions and value additions are most welcome


For regular updates, please register here

Subscribe

References

https://www.worldometers.info/world-population/china-population/#:~:text=The%20current%20population%20of%20China,of%20the%20total%20world%20population.

https://www.statista.com/statistics/263765/total-population-of-china/

https://en.wikipedia.org/wiki/Demographics_of_China

https://data.worldbank.org/indicator/SP.POP.TOTL?locations=CN

https://www.visualcapitalist.com/the-population-of-china-compared-with-the-rest-of-the-world/

201: MILITARY SPENDING: FACTS, TRENDS & ANALYSIS

Pic courtesy: military mortgage center

SIPRI (Stockholm International Peace Research Institute) is an independent international institute dedicated to research into conflict, armaments, arms control and disarmament. Established in 1966, SIPRI provides data, analysis and recommendations, based on open sources, to policymakers, researchers, media and the interested public.

SIPRI Yearbook 2021 has been published and it presents a combination of original data in areas such as world military expenditure, international arms transfers, arms production, nuclear forces, armed conflicts and multilateral peace operations.

Relevant extracts on military expenditure are given below:-


World Military Expenditure


The growth in total spending in 2020 was largely influenced by expenditure patterns in the United States and China.


World military expenditure is estimated to have been US$1981 billion in 2020. Total spending was 2.6 per cent higher than in 2019 and 9.3 per cent higher than in 2011.


Military spending increased in at least four of the world’s five regions is :-
• 5.1 per cent in Africa
• 4.0 per cent in Europe
• 3.9 per cent in the Americas
• 2.5 per cent in Asia and Oceania.


Impact of Covid-19


While the impact of the Covid-19 pandemic on military spending will become clearer in the coming years, general observations about its impact are as follows:-


  • Several countries are known to have reduced or diverted military spending to address the pandemic.


  • The military burden in a majority of states increased in 2020.


  • Most countries used military assets, especially personnel, to support their responses to the outbreak of Covid-19.


The Largest Military Spenders in 2020


The USA increased its military spending for the third straight year to reach $778 billion in 2020, a 4.4 per cent increase since 2019 but a 10 per cent decrease since 2011.


China’s military expenditure is estimated at $252 billion in 2020, representing an increase of 1.9 per cent since 2019 and 76 per cent since 2011. Chinese spending has risen for 26 consecutive years. It is the longest streak of uninterrupted increases by any country in the SIPRI Military Expenditure Database.


India’s spending of $72.9 billion, an increase of 2.1 per cent in 2020, ranked it as the third highest spender in the world.


Russia’s total military spending was $61.7 billion. This was 2.5 per cent higher than in 2019, but 6.6 per cent lower than the initial budget for 2020.


The fifth biggest spender, the United Kingdom, raised its military expenditure by 2.9 per cent in 2020. This was the UK’s second highest annual growth rate in the period 2011–20, a decade that until 2017 was characterized by military spending cuts.


Main Exporters and Importers


Observations and Analysis


  • USA and China are the major influencers in military spending.


  • USA continues to be highest spender (way ahead of others including China), trying to retain its most powerful status.


  • China’s expenditure figure is 1/3rd of USA, but China could be spending more than it declares.


  • The trend of China’s expenditure (Continuous rise in its spending for last 26 years) shows her resolve to enhance her military power.


  • USA and China expenditure patterns indicate a beginning of second cold war.


  • Covid pandemic has reduced military expenditure in most of the countries.


  • India’s amount on military expenditure is although third highest in the world, but is 1/3rd of that of China and 1/10th of that of USA.


  • Russia although is trying to regain its lost glory but spending less on military, apparently due to financial constraints and development priorities.


  • Arms export is led by USA with major chunk of 37% export market.


  • Russia still has a foothold in the military export market with number two position with reasonable figure of 20%.


  • China figures in the both the lists of import and export at number 5 position with approximately 5% in both. However it is trying to capture more and more of world military market share.


  • India continues to maintain the dubious record of being at number two place in the defence imports list, behind Saudi Arabia.


Bottom Line

India cannot match China in defence expenditure.


Question

Will India be able to break its dependence on military imports?


Wild Thought

Maybe the unrest world over is sponsored by the arms industry.


Suggestions and value additions are most welcome


For regular updates, please register here

Subscribe

195: Listening Skills: Two Ears – Eight Ways to Use Them


Humans, as social beings, have a physiological and psychological need to connect and communicate.


Communication, by definition, is a 2-way process and while being able to articulate one’s thoughts is critical, being able to listen well is equally critical in any communication.


Listening is a critical life skill.


Types of listening.

Continue reading “195: Listening Skills: Two Ears – Eight Ways to Use Them”

English हिंदी