Pic Courtesy: Businessline
Italian statistician Corrado Gini, developed the Gini coefficient in 1912. It ranges from 0 to 1, but is often written as a percentage.
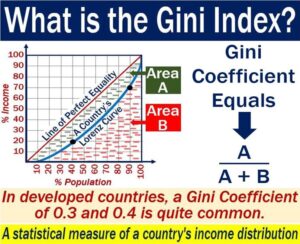
Defnition. The Gini coefficient (also known as Gini index or Gini ratio) is one of the most frequently used statistical measure of economic inequality in a population. The coefficient measures the dispersion of income or distribution of wealth among the members of a population.
Importance. A country’s Gini coefficient is important because it helps identify high levels of income inequality, which can have several undesirable political and economic impacts. These include slower GDP growth, reduced income mobility, greater household debt, political polarization, and higher poverty rates.
Repercussions.
- An increase in the Index implies that the government’s policies benefit the rich more than the poor and are not inclusive enough.
- So, a higher ratio may encourage the government to spend more on social welfare schemes and also increase the tax burden on the rich.
- It is important that the government tries to maintain a good ratio so that the rich-poor divide can be kept in check.

Pic Courtesy: Market business news
Values. The coefficient can take any values between 0 to 1 (or 0% to 100%). A coefficient of zero indicates a perfectly equal distribution of income or wealth within a population. A coefficient of one represents a perfect inequality when one person in a population receives all the income, while other people earn nothing. The coefficient generally ranges from 24% to 63%. A value below 0.4 is considered acceptable generally.
Please note that the Gini coefficient is not an absolute measure of a country’s income or wealth. The coefficient only measures the dispersion of income or wealth within a population.
Principles of the Gini Coefficient
Population Independence. The coefficient does not depend on the size of the population.
Scale of independence. The calculation of the Gini coefficient does not depend on how large the economy is, how it is measured, or how wealthy a country is. For example, both rich and poor countries may show the same coefficient due to similar income distribution.
Anonymity. The coefficient does not disclose the identities of high-income and low-income individuals in a population.
Limitations of the Gini Coefficient
Sample bias. The validity of Gini coefficient calculations can be dependent on the size of a sample.
Data inaccuracy. The Gini coefficient is prone to systematic and random data errors. Therefore, inaccurate data can distort the validity of the coefficient.

Pic Courtesy: Geo currents
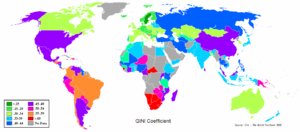
Top 10 Countries with the Highest Gini Coefficients (World Bank):
South Africa – 2014 – 63.0
Namibia – 2015 – 59.1
Suriname – 1999 – 57.9
Zambia – 2015 – 57.1
Sao Tome and Principe – 2017 – 56.3
Central African Republic – 2008 – 56.2
Eswatini – 2016 – 54.6
Mozambique – 2014 – 54.0
Brazil – 2019 – 53.4
Belize – 1999 – 53.3
Top 10 Countries with the Lowest Gini Coefficients (World Bank):
Slovenia – 2018 – 24.6
Czech Republic – 2018 – 25.0 (tie)
Slovakia – 2018 – 25.0 (tie)
Belarus – 2019 – 25.3
Moldova – 2018 – 25.7
United Arab Emirates – 2018 – 26.0
Iceland – 2017 – 26.1
Azerbaijan – 2005 – 26.6 (tie)
Ukraine – 2019 – 26.6 (tie)
Belgium – 2018 – 27.2
India. India ranks 98 with the Gini Coefficient of 35.7. The trend over the years, indicates that inequality in India is increasing.
Global Index. The Gini coefficient for the entire world has been estimated by various parties to be between 0.61 and 0.68. The Gini coefficient saw sustained growth during the 19th and 20th centuries. In 1820, the global Gini coefficient was 0.50, and in 1980 and 1992, the figure was 0.657.
Analysis.
- Nordic and Central Eastern European countries dominate this list, claiming seven of the top 10 slots.
- Inequality is generally lower in Europe than elsewhere in the world.
- The United States has a Gini coefficient of 41.1. In 2015, the top 1% of earners in the United States averaged 40 times more income than the bottom 90%. In the U.S., poverty is a growing issue, where an estimated 12.3-17.8 percent below the poverty level (see Poverty Rate by Country). Many of these low-wage workers live paycheck-to-paycheck and have no sick days, pension, or health insurance.
- Some of the world’s poorest countries (Central African Republic) have some of the world’s highest Gini coefficients (61.3), while many of the wealthiest (Denmark) have some of the lowest (28.8).
- Pandemic Effect. According to World Bank’s Poverty and Shared Prosperity 2020 report, the Gini coefficient increases about 1.5 points in the five years following major epidemics, such as H1N1 (2009), Ebola (2014), and Zika (2016). While the effects of the COVID-19 pandemic are still being calculated, early estimates predicted an increase in Gini coefficient of 1.2-1.9 percentage points per year for 2020 and 2021, signalling an increase in income inequality.
Interesting Aphorism
“A rising tide lifts all boats”
This is associated with the idea that an improved economy will benefit all participants and that economic policy, particularly government economic policy, should therefore focus on broad economic efforts.
Other Interesting Ones
“What serves one, serves all”.
“What disserves one, disserves all”.
“All for one and one for all”.
Question
Are India’s policies pro rich?
Suggestions and value additions are most welcome
For regular updates, please register here
References
https://en.wikipedia.org/wiki/Gini_coefficient
https://www.investopedia.com/terms/g/gini-index.asp
https://corporatefinanceinstitute.com/resources/knowledge/economics/gini-coefficient/
https://worldpopulationreview.com/country-rankings/gini-coefficient-by-country

The pandemic has been an additional burden that has added to the rising inequality in India.
Not only in India but world over.
Historically inequality has always increased after a pandemic.
Thanks for uploading. Always wanted to know more about this economic indicator. The ( ex) socialist countries fare better !
The correlation between Gini Coefficient and social unrest in a country could be another interesting topic perhaps.
Consequently increase in budget and size of law enforcement agencies.
The whole idea is to gauge the potential for social unrest when the index is high.
Governments do take appropriate policy decisions and actions to regulate the index and maintain it at a safe level.